Using reflective foil as a vapour barrier
The experiment
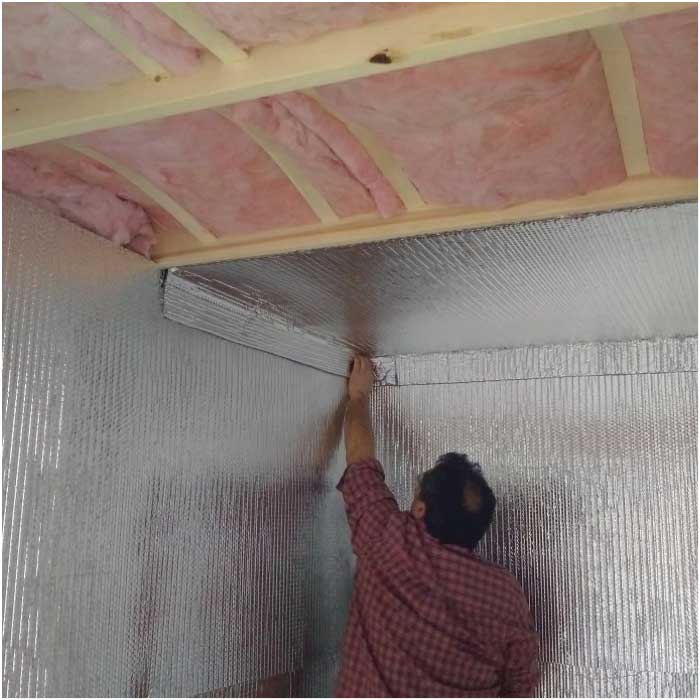
Following the codes and standards for regular wall systems in the northern B.C. residential building sector, two identical sheds were constructed by the Carpentry Department of the CNC School of Trades & Technology. Shed 1 had the reflective foil stapled to the studs (Figure 1), strapped horizontally with 25 x 50-mm (1 x 2-in.) wooden straps and then drywalled. Shed 2 was built with a regular poly vapour barrier and gypsum boards attached directly to the studs.
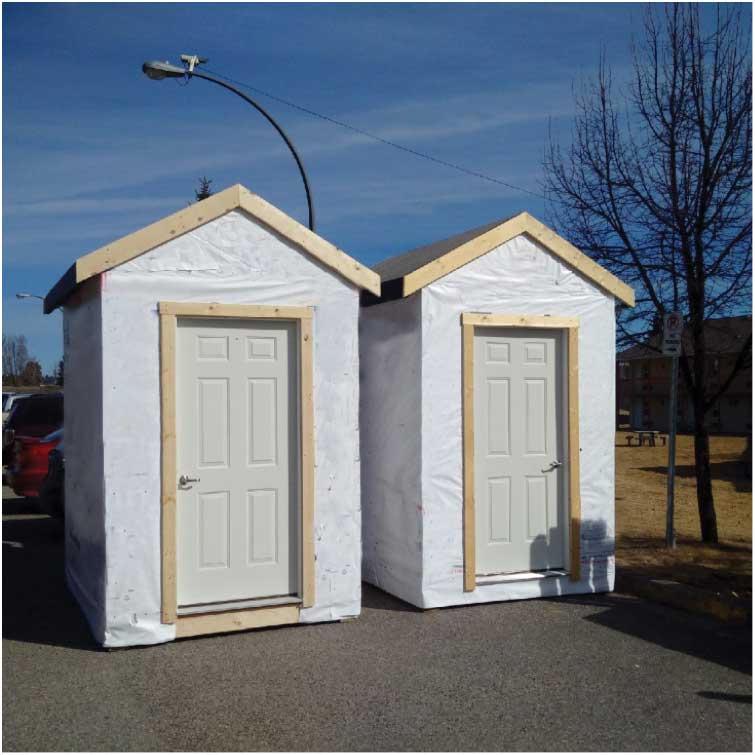
The sheds were placed in the CNC Residence parking lot (Figure 2), and exposed to similar environmental conditions, such as insolation, wind, and shade. Each shed was heated by a 700-W capacity electric shop-heater, plugged in through an energy logger. The inside temperature in each shed was controlled by a thermostat. Temperature loggers recorded the inside and outside temperatures. Relative humidity (RH) meters were placed in each shed.
The first week of measurements took place between April 13 and April 20, 2017. (The reasons for the timing of the study were purely administrative—the project was approved in January for six months and the college’s carpentry instructor and students could build the sheds only after the semester was done [i.e. March 31]. For a comparative study, temperature difference was not an issue. Heat loss would have been more dramatic had the work occurred in winter, making the results a little bit more accurate.) After the first week, Shed 1 had the reflective foil replaced by poly vapour barrier but the 25-mm straps were kept in place. There was no change applied to Shed 2. Heat loss measurements were replicated for another week, between April 23 and April 30. The energy savings were calculated by comparing the total heat losses over one week, adjusted to a common temperature differential of 20 C (36 F), and to the same interior surface size.
Shed dimensions and nominal R-values
Each shed was 2.4 m (8 ft) long, 1.8 m (6 ft) wide, and 2.4 m tall; the tip of the roof was 3 m (10 ft) from the ground. The walls were built using standard 2×6 frame construction, while the ceiling was filled with 305 mm (1 ft) of insulation. As a result, the interior dimensions of the two sheds were:
- Shed 1 (2×6 studs, reflective foil, 25-mm [1-in.] straps, and 12-mm [½ in.] drywall): 2.06 m (6 ft
9 in.) long, 1.45 m (4 ft 9 in.) wide, and 2.09 m (6 ft 10 ½ in.) tall for total interior surface area: 20.65 m2 (222.25 sf); and - Shed 2 (2×6 studs, poly vapour barrier, and 12-mm [½ in.] drywall): 2.11 m (6 ft 11 in.) long, 1.50 m (4 ft 11 in.) wide, and 2.12 m (6 ft 11½ in.) tall for total interior surface area: 21.62 m2 (232.69 sf).
Since Shed 1’s interior surface area was 4.5 per cent smaller than that of Shed 2, a correction factor of 1.047 was used to adjust the recorded heat loss in the latter before being compared to the heat loss in Shed 1 for evaluating potential energy savings.
The estimated nominal R-values of the walls, ceiling, floor, and door are:
- walls: R-22;
- ceiling: R-40;
- floor: R-1.5; and
- door: R-5.
(However, the effective R-values of the various assemblies may be different.)
Recorded data
Temperature was recorded using LogTag temperature loggers, with data downloaded through that company’s Analyzer software. The interior loggers were placed in the centre of the sheds, at 0.46 m (1 ½ ft) from the ceiling and 1.7 m (5 ½ ft) from the floor. Interior temperature was recorded at 10-minute intervals and averaged over the entire reading period of one week (for a total of 1008 data readings). Recorded interior temperature was in the range of 25.5 to 28.5 C (77.9 to 83.3 F).
Exterior temperature was recorded at one-hour intervals and averaged over 168 hours—the equivalent of one week time. The average exterior temperature was 5.6 C (42.1 F) in the first week and 7.6 C (45.7 F) in the second week. The maximum exterior temperature never exceeded the minimum interior temperature—an indication heat transferred from interior to exterior at all times.
Energy consumption was measured using Onset Data Loggers connected to individual 700-W heaters in each shed. Each heater was coupled to a thermostat, which was placed at the same location as the temperature data recorders. Energy data was downloaded using the HOBOware software and recorded at 10-minute intervals.
Sign up for our weekly newsletter
Construction Canada weekly newsletters give the latest AEC industry news for those who build, design, engineer, specify, renovate or operate in the built environment.
Related Products & Services
Read the Latest Issue