Updating building codes in response to climate change

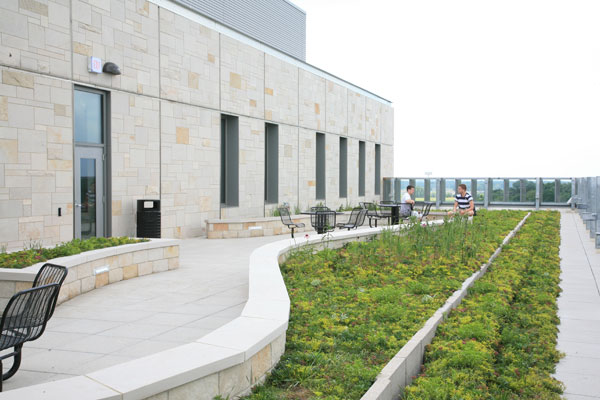
Images © Fariz Dhalla
Historic and projected climate data
Historic weather data gathered at Toronto’s Pearson International Airport shows maximum, minimum, and average temperatures have steadily increased from 1979 to 2009 (Figure 1).
A comparison between 2040 to 2049 projected data and 2000 to 2009 historic data from “Toronto’s Future Weather and Climate Driver Study” (“Toronto’s Future Weather”) indicates minimum, maximum, and average temperatures will continue to rise (Figure 2). The study suggests projected temperatures may be overestimated by up to 2.6 C (37 F). However, the temperatures in Figure 2 nonetheless illustrate a significant warming trend. (The study, undertaken by SENES Consultants for the City of Toronto, can be downloaded online here.)
“Toronto’s Future Weather” is a detailed climate study providing regional projected weather data. It is based on the Intergovernmental Panel on Climate Change (IPCC) A1B climate change scenario, a mid-point of greenhouse gas (GHG) emissions severity among the various IPCC emissions scenarios.
Case study of a high-rise office tower
In an effort to evaluate the impact of increasing local temperatures, a case study on an archetypal high-rise commercial office tower was completed. Created using a building energy simulation program meeting code software requirements, the tower possesses the following parameters:
- a gross floor area of 44,593 m2 (480,000 sf);
- a total of 36 floors, comprising six podium floors along with 30 tower floors;
- a window-to-wall ratio of 30 per cent for the podium floors and 80 per cent for the tower floors;
- a glazing system thermal conductivity rating (U-value) of 1.987 W/m2/K (0.35 Btu/h/sf/F);
- a glazing solar heat gain co-efficient (SHGC) of 0.37;
- a chiller co-efficient of performance (COP) of 5.5;
- a boiler efficiency of 91.5 per cent (condensing type)’;
- pump control with variable speed drives; and
- light power density of 1.1 W/sf.
The mechanical systems were auto-sized by the software to meet heating and cooling loads. While mechanical system efficiencies remained consistent across all models, equipment capacities fluctuated to meet the loads of current and projected climates.
Current and projected weather data from “Toronto’s Future Weather” are not yet available in a useable format, so the data used for modelling was exported from software containing worldwide weather data. The projected weather data from the 2050 to 2059 period was selected as representative of a 30-year projection, and was based on the IPCC A2 emission scenario, which is the worst-case future GHG emission scenario. Current weather data was based on observed values during the 2000 to 2009 period at a weather station in Toronto. Changes in various monthly temperature measurements between the 2050 to 2059 and 2000 to 2009 periods are shown in Figure 3.
The temperature values in Figure 3 are noticeably lower than those in Figure 2, likely because IPCC global climate models are based on average future climate conditions, while data from higher-resolution modelling in “Toronto’s Future Weather” includes weather extremes. The temperature increases shown in the case study are expected to be smaller than actual future weather projections—as such, the case study is an illustration of the relative impacts of climate change.
Results
The case study models showed energy usage from cooling increased by five per cent, increasing building operating costs. Energy usage from heating was reduced by about nine per cent in the 2050s model, which completely offsets the total cooling energy usage increases.
Using current costs for electricity and natural gas, total energy costs were calculated for both modelling scenarios. A five per cent increase was observed in yearly costs for heating and cooling (Figure 4).
Using outputs from the future energy model, improvements in window-to wall-ratio, glazing SHGC, and U-value were also compared. The goal was to determine which of the parameters included in the code’s prescriptive path have the greatest impact on building energy use and building energy costs.
Window-to-wall ratio was found to have the most significant effect, followed by SHGC. U-value improvements had the smallest impact on energy use and resulted in increased energy costs, since these improvements reduce heat rejection through the exterior walls, increasing the requirement for mechanical cooling during spring and fall. Figures 5 and 6 illustrate the relative impacts of improving the three exterior wall parameters.
Analysis
The case study suggests high-rise buildings with primarily glass cladding require improvements if they are to counteract climate change-induced increases in cooling requirements and energy use costs.
Improvements in window-to-wall ratio, SHGC, and U-value have different impacts on energy use, so larger-scale, more-detailed studies should be done to find which among these most effectively counteract climate change’s effects on building energy use. The findings of this type of sensitivity analysis could inform changes to prescriptive requirements in upcoming versions of OBC, to address effects of climate change on building energy use.
The trend in recent energy code versions, including American Society of Heating, Refrigerating, and Air-conditioning Engineers (ASHRAE) 90.1, Energy Standard for Buildings Except Low-rise Residential Buildings, which the OBC references, has been to emphasize reducing thermal transmittance through the envelope (Figure 7). While there are various documented advantages to improving envelope U-values, it is apparent reducing heat loss through exterior walls—particularly in winter and shoulder seasons—yields diminishing returns in reducing overall energy usage.
Reducing SHGC has significantly greater impact, yet prescriptive requirements for this value have remained largely unchanged over the last several code versions. Additionally, where efficiencies in other building systems have historically been used to allow buildings to exceed prescriptive fenestration ratios, re-evaluation may be required under future climate conditions, as these may not result in equivalent energy savings.
The specified slider id does not exist.
Sign up for our weekly newsletter
Construction Canada weekly newsletters give the latest AEC industry news for those who build, design, engineer, specify, renovate or operate in the built environment.
Products & Services

Read the Latest Issue