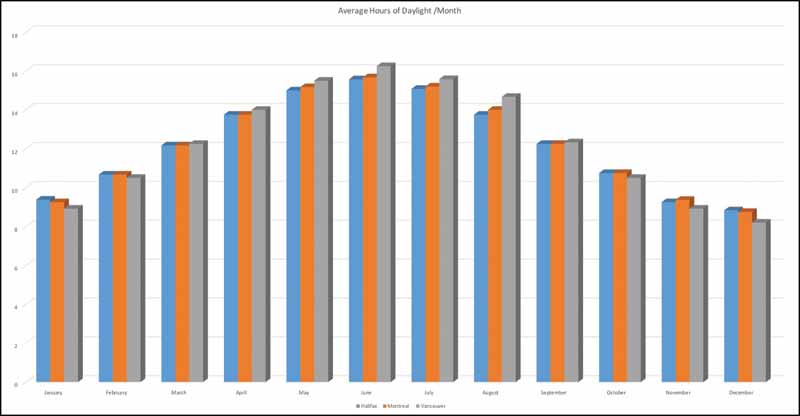
daylight-graph


| Cookie | Duration | Description |
|---|---|---|
| cookielawinfo-checkbox-advertisement | 1 year | Set by the GDPR Cookie Consent plugin, this cookie is used to record the user consent for the cookies in the "Advertisement" category . |
| cookielawinfo-checkbox-analytics | 1 year | Set by the GDPR Cookie Consent plugin, this cookie is used to record the user consent for the cookies in the "Analytics" category . |
| cookielawinfo-checkbox-functional | 1 year | The cookie is set by the GDPR Cookie Consent plugin to record the user consent for the cookies in the category "Functional". |
| cookielawinfo-checkbox-necessary | 1 year | Set by the GDPR Cookie Consent plugin, this cookie is used to record the user consent for the cookies in the "Necessary" category . |
| cookielawinfo-checkbox-others | 1 year | Set by the GDPR Cookie Consent plugin, this cookie is used to store the user consent for cookies in the category "Others". |
| cookielawinfo-checkbox-performance | 1 year | Set by the GDPR Cookie Consent plugin, this cookie is used to store the user consent for cookies in the category "Performance". |
| JSESSIONID | session | The JSESSIONID cookie is used by New Relic to store a session identifier so that New Relic can monitor session counts for an application. |
| viewed_cookie_policy | 1 year | The cookie is set by the GDPR Cookie Consent plugin to store whether or not the user has consented to the use of cookies. It does not store any personal data. |
| Cookie | Duration | Description |
|---|---|---|
| PHPSESSID | session | This cookie is native to PHP applications. The cookie is used to store and identify a users' unique session ID for the purpose of managing user session on the website. The cookie is a session cookies and is deleted when all the browser windows are closed. |
| wordpress_test_cookie | session | This cookie is used to check if the cookies are enabled on the users' browser. |
| __cf_bm | 30 minutes | This cookie, set by Cloudflare, is used to support Cloudflare Bot Management. |
| Cookie | Duration | Description |
|---|---|---|
| CONSENT | 2 years | YouTube sets this cookie via embedded youtube-videos and registers anonymous statistical data. |
| _ga | 2 years | The _ga cookie, installed by Google Analytics, calculates visitor, session and campaign data and also keeps track of site usage for the site's analytics report. The cookie stores information anonymously and assigns a randomly generated number to recognize unique visitors. |
| _gat | 1 minute | This cookie is installed by Google Universal Analytics to restrain request rate and thus limit the collection of data on high traffic sites. |
| _gat_UA- | 1 minute | A variation of the _gat cookie set by Google Analytics and Google Tag Manager to allow website owners to track visitor behaviour and measure site performance. The pattern element in the name contains the unique identity number of the account or website it relates to. |
| _gid | 1 day | Installed by Google Analytics, _gid cookie stores information on how visitors use a website, while also creating an analytics report of the website's performance. Some of the data that are collected include the number of visitors, their source, and the pages they visit anonymously. |
| Cookie | Duration | Description |
|---|---|---|
| ADV_u_id | 3 months 8 days | Unique customer identifier used to track unique ad views and interactions with some ads. |
| IDE | 1 year 24 days | Google DoubleClick IDE cookies are used to store information about how the user uses the website to present them with relevant ads and according to the user profile. |
| loc | never | AddThis sets this geolocation cookie to help understand the location of users who share the information. |
| OAGEO | session | OpenX sets this cookie to avoid the repeated display of the same ad. |
| OAID | 1 year | Cookie set to record whether the user has opted out of the collection of information by the AdsWizz Service Cookies. |
| test_cookie | 15 minutes | The test_cookie is set by doubleclick.net and is used to determine if the user's browser supports cookies. |
| VISITOR_INFO1_LIVE | 5 months 27 days | A cookie set by YouTube to measure bandwidth that determines whether the user gets the new or old player interface. |
| vuid | 2 years | Vimeo installs this cookie to collect tracking information by setting a unique ID to embed videos to the website. |
| YSC | session | YSC cookie is set by Youtube and is used to track the views of embedded videos on Youtube pages. |
| yt-remote-connected-devices | never | YouTube sets this cookie to store the video preferences of the user using embedded YouTube video. |
| yt-remote-device-id | never | YouTube sets this cookie to store the video preferences of the user using embedded YouTube video. |
| yt.innertube::nextId | never | This cookie, set by YouTube, registers a unique ID to store data on what videos from YouTube the user has seen. |
| yt.innertube::requests | never | This cookie, set by YouTube, registers a unique ID to store data on what videos from YouTube the user has seen. |
| Cookie | Duration | Description |
|---|---|---|
| geolocation | 7 days | Used to display branded items. |