Staying street SMART with project management
Step 7: Create schedule
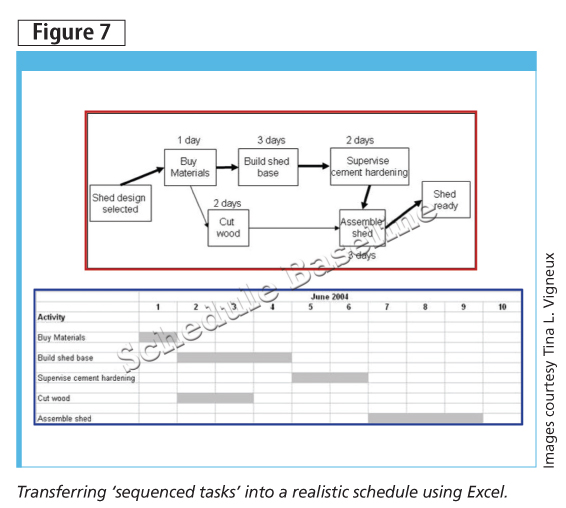
Figure 8 displays how to transfer ‘sequenced tasks’ into a realistic schedule using Excel. The final result is a Gantt chart—a horizontal bar chart depicting progress in relation to time using MS Project (Figure 9).
Step 8: Cost budgeting
Cost-budgeting involves allocating the project cost estimate to individual work items over time. The important goal is to produce a cost baseline—a time-phased budget that project managers use to measure and monitor cost performance. Cost budgets outline how and when the allocated budget will be disbursed (Figure 10).
Step 9: Monitor and control
Once the schedule and cost baselines (i.e. approved plan for the project) are completed, one can determine how the project is proceeding by using simple EV calculations. EV analysis is an industry standard way to measure a project’s progress, forecast its completion date and final cost, and provide schedule and budget variances along the way.
Calculating earned value
This author finds many design/construction professionals are reluctant to reap the benefits of EV calculations, whether because it is ‘math’ or they simply find the process confusing. However, the calculations themselves are extremely basic (i.e. subtraction and division), the information required to determine EV is already available, and the result is a feeling of control over the outcome of a project. The breakdown of these definitions to their most basic explanation should eliminate any confusion.
EV uses just three data points:
- planned value (PV): the amount of work planned to complete by a given date (in dollars);
- earned value (EV): the amount of work actually completed by the same date (in dollars); and
- actual cost (AC): how much did the work completed actually cost.
The ‘variances’ for schedule and cost determine whether a project is in trouble, with negative numbers indicating problems. As well, a Cost Performance Index (CPI) or Schedule Performance Index (SPI) less than ‘1’ indicates problems—the work might be more costly than planned (i.e. over-budget) or taking longer than planned (i.e. behind schedule).
Figure 11 is a basic schedule where the:
- entire box (black outline) shows the planned schedule;
- shaded areas within the box show the work completed;
- whole numbers at top right corner of boxes are the days estimated to complete each task;
- dark black vertical line displays the date/point on the schedule being checked for variances; and
- percentages at the bottom of each box explain the amount of work that should have been completed by this point, and what was actually finished.
In this example, there are four tasks/activities: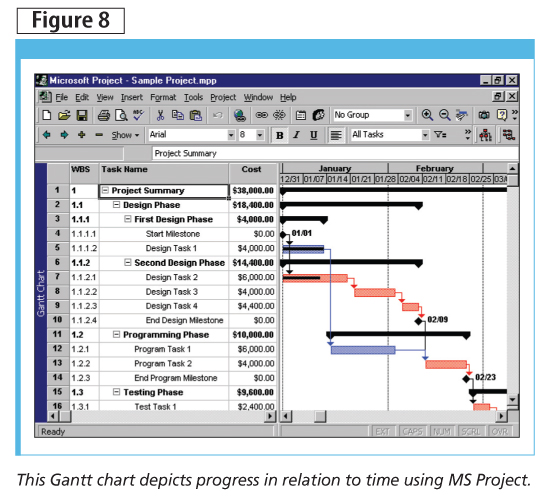
- Activity A is completed and took 18 days.
- Activity B is 80 per cent complete; when finished, it will take 10 days.
- Activity C is 70 per cent complete; when finished, it will take 20 days.
- Activity D has not begun, but will take 40 days to complete.
The dark black vertical line represents ‘today.’ To determine how the project is doing, the calculations are as follows:
Planned value
- Activity A (18 days) + Activity B (10 days) + Activity C (16 days [80% of 20 days]) + Activity D (6 days [15% of 40 days])
- PV = 18 + 10 + 16 + 6 = $50
Earned value
- Activity A (18 days) + Activity B (8 days [should have taken 10, but is only 80% complete]) + Activity C (14 days [planned to finish 80% of the task by this date, but only completed 70%] + Activity D (0 days [planned to complete 15% by this date, but did not begin])
- EV = 18 + 8 + 14 + 0 = $40
Actual cost
This number is typically provided by whoever does the firm’s accounting/finance. Every project a company executes is ideally tracked through the finance department. The total amount ‘paid out’ to date (i.e. what the completed work actually cost) is the actual cost (AC). For this example, the AC is $45.
Sign up for our weekly newsletter
Construction Canada weekly newsletters give the latest AEC industry news for those who build, design, engineer, specify, renovate or operate in the built environment.
Products & Services


Read the Latest Issue