Reducing energy consumption with continuous insulation
Model methodology
The prototypes used for the modelling were U.S. Department of Energy (DOE) commercial reference buildings models (Version 1.3), which employ the ‘design flow rate’ model for air leakage rates. (See M. Deru et al’s U.S. Department of Energy Commercial Reference Building Models of the National Building Stock, published by the DOE’s Energy Efficiency and Renewable Energy’s (EERE’s) Office of Building Technologies). Air infiltration is assumed in perimeter zones only; it is reduced to 25 per cent of full value when the ventilation system is running.
This modelling does not account for stack effect—the flow of air resulting from warm air rising, which creates positive (i.e. outward) pressure at the top of a building and negative (i.e. inward) pressure at the bottom. Had stack effect been included, a slightly higher air leakage rate would be expected.
While air leakage is typically specified and measured based on a differential pressure of 75 Pa (1.57 psf) across the building enclosure, the actual pressure under normal operating conditions is substantially lower. For this reason, the air leakage rates used in the energy models are normalized to a pressure of 4 Pa (0.08 psf) following DOE guidelines. (The procedure is described in K. Gowri, D. Winiarski, and R. Jarnagin’s Infiltration Modeling Guidelines for Commercial Building Energy Analysis [DOE Pacific Northwest National Laboratory, 2009]).
Taking a base air leakage rate of 2 L/s•m2 (0.4 cfm/sf) of above-grade wall area at 75 Pa (1.57 psf) and normalizing this to an air leakage rate at 4 Pa results in an air leakage rate of 0.3 L/s•m2 (0.0595 cfm/sf) of exterior surface area. The air leakage rates for the 1.3 L/s•m2 (0.25 cfm/sf), and 7.9 L/s•m2 (1.55 cfm/sf) at 75 Pa scenarios were then scaled from this base case.
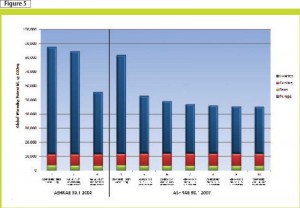
Heating, cooling, lighting, and interior equipment energy consumption were modelled for each load case at 10-minute intervals, with the results summarized on a monthly usage basis in units of kilowatt hours (kWh). This data was then used to calculate heating and cooling energy consumption on an annualized basis; energy costs, energy savings over the base case, and carbon equivalent were calculated based on the annual heating and cooling costs.
Energy model results
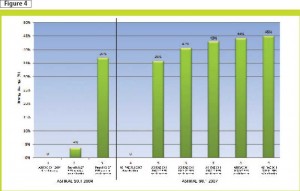
The energy modelling results for Toronto are presented graphically in Figures 3 to 5. It is clear substantial energy savings can be realized through a combined air barrier/EIFS assembly. Annualized heating and cooling energy savings ranged from approximately 20 to 45 per cent with greater savings achieved in colder climates (in this case, Toronto).
In all climate zones, reducing air leakage was found to have a much greater impact on energy savings than adding continuous insulation alone. Again, greater savings were achieved in the colder climates.
The energy savings achieved was upward of 450 to 950 per cent greater than for adding insulation alone without reducing air leakage.
The following annualized heating and cooling energy savings were realized by adding a 50-mm (2-in.) EIFS assembly with air leakage controlled to 1.3 L/s•m2 @ 75 Pa (0.25 cfm/sf @ 1.57 psf) air barrier relative to a baseline ASHRAE 90.1-2007 new building:
- Toronto–43 per cent energy savings;
- Seattle–36 per cent energy savings; and
- Dallas–20 per cent energy savings.
The following annualized heating and cooling energy savings were realized by retrofitting a baseline ASHRAE 90.1-2004 building with 51 mm of EIFS and a 2 L/s•m2 @ 75 Pa (0.4 cfm/sf @ 1.57 psf)
air barrier:
- Toronto–37 per cent energy savings;
- Seattle–34 per cent energy savings; and
- Dallas–21 per cent energy savings.
Ultimately, there is a diminishing return in energy cost savings as R-value is increased.
Conclusion
The modelling demonstrates EIFS and air barriers are effective in reducing energy consumption both for new construction and for retrofit applications. Although durability was not considered within this study, the drainability of such systems, along with the hygrothermal properties, also improve the long-term success of the wall assembly. The beneficial hygrothermal properties of EIFS systems have been demonstrated in prior studies by Oak Ridge National Laboratories (ORNL).
Chris Norris, P.Eng, PE, LEED AP, is a principal and building envelope specialist with Morrison Hershfield. He leads new construction and retrofit building enclosure projects across the country. Norris has 12 years of experience in the building envelope field. He can be contacted at cnorris@morrisonhershfield.com.
Bryce Brandon, MBA, LEED GA, is the senior market manager for the exterior insulation and finish systems (EIFS) and coatings product lines in North America at Sto Corp. He is responsible for identifying new business opportunities and leading project teams to achieve business objectives. Brandon can be reached at bbrandon@stocorp.com.
Medgar Marceau, PE, ASHRAE, CSI, CDT, LCA CP, LEED AP, is a building science consultant with Morrison Hershfield. For 12 years, he has been consulting in the areas of building science, sustainability, and environmental lifecycle assessment (LCA). Marceau specializes in high-performance building enclosure design and construction, whole-building energy simulation, and LCA. He can be contacted via e-mail at mmarceau@morrisonhershfield.com.
Sign up for our weekly newsletter
Construction Canada weekly newsletters give the latest AEC industry news for those who build, design, engineer, specify, renovate or operate in the built environment.
Products & Services
Read the Latest Issue