Corporate Confidential: Understanding acoustic privacy within the built environment
To calculate AI, one uses a test signal including the frequencies known to specifically impact speech comprehension. This signal is measured at 1 m (3.2 ft) from the ‘source’ and again at the ‘listener’ location. The background sound level is also measured at the ‘listener’ location in order to quantify how loud the test signal is relative to it—a value known as the signal-to-noise ratio (SNR). This value is critical, because the lower the SNR, the less the intelligibility and the greater the speech privacy.
For AI, SNR is measured in each of 15 frequency ranges (from 200 to 5000 Hz). Each of these ranges is weighted according to the degree to which it contributes to speech comprehension. The final AI value ranges from 0 (where conversation is completely unintelligible) to 1 (where everything is heard and understood). The human voice varies from person to person, depending on factors such as sex and age.
AI ratings are challenging to interpret in a meaningful way, so studies have been done to correlate them to subjective ‘privacy’ categories. However, the value of these groupings is somewhat diluted by the wide range of comprehension within each one:
- ‘confidential’ privacy ranges from 0 to 0.1;
- ‘‘normal’ from 0.1 to 0.2; and
- ‘‘marginal’ from 0.2 to 0.3.
If AI is above 0.3, there is effectively no privacy.
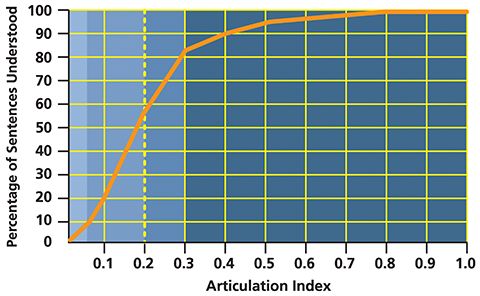
As shown in Figure 1, the relationship between AI and actual comprehension is not linear. On a 0 to 1.0 scale, many would expect a value of 0.5 to mean listeners would understand 50 per cent of a conversation, but—as is clear from the graph—they would actually understand approximately 95 per cent. The shaded areas along the left of the graph show the confidential, normal, and marginal privacy ranges, indicating just how low an AI is required for true privacy.
A more recent arrival on the acoustical scene is a metric called the Privacy Index (PI). PI is based on AI, in that it is calculated as 1.0 minus the AI value, multiplied by 100, and expressed as a percentage; in other words:
1–AI x 100 = PI (%)
However, PI can be misleading. Part of the problem likely stems from its use of the word ‘privacy,’ which can cause users to come to the wrong conclusion about the rating’s meaning. The fact it is expressed as a percentage creates even more potential for confusion. For example, with an AI of 0.3, there is a PI of 70 per cent.
Figure 1 demonstrates the reason to avoid this metric. When told the PI is 70 per cent, most would assume they would only understand 30 per cent of what is being said. In reality, nearly 85 per cent would be understood. Thus, building professionals should be cautious when investigating acoustical solutions and interpreting related PI statements.
How sound travels
To design the built environment for acoustic privacy, it is also important to understand the three ways sound (e.g. voice) travels to a listener.
Sound follows a direct path when it travels uninterrupted from the source to the listener or penetrates a barrier between them, such as a wall. This transmission path contributes the most to high levels of speech reaching the listener. In this context, high levels refer to more intelligible words at a relatively high volume. However, it can also travel on a reflected path. This type of transmission occurs when sound bounces off the various surfaces within the space, such as floors, ceilings, walls, and furnishings. Finally, it should be noted that sound can travel in a diffracted path—that is, it can bend around obstacles. This pathway is generally less significant than the first two.
Since speech travels in these various ways, it can be difficult to contain. Several methods must be employed because no single technique can sufficiently address all transmission pathways.
Sign up for our weekly newsletter
Construction Canada weekly newsletters give the latest AEC industry news for those who build, design, engineer, specify, renovate or operate in the built environment.
Products & Services
Read the Latest Issue