Advancing the quality of light
Measuring quality of light
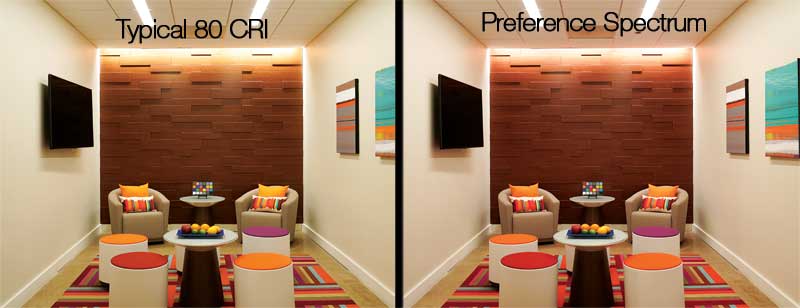
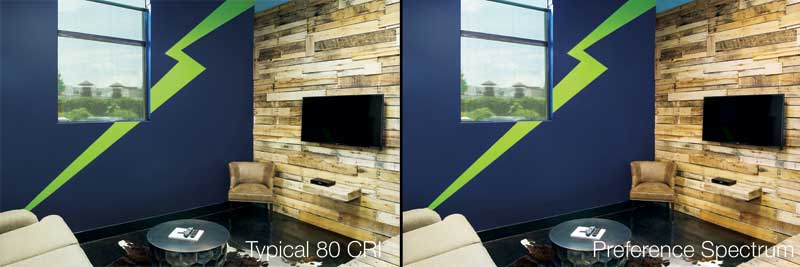
Released in the 1960s, the colour rendering index (CRI) is the most common measure for light colour quality. It is only a measurement of fidelity, as it describes the accuracy of a light source to a reference illuminant (i.e. a blackbody radiator) on a scale up to 100. A score of 80 CRI is considered acceptable and has become a baseline for most light sources specified in commercial environments. Having said that, 90 CRI is the common specification point used today for high quality as it is more similar to the reference illuminant.
As explained, CRI is a single number, an easy-to-understand rule of thumb describing how a light source differs from a reference illuminant without describing the direction of change in either chroma or hue. In simple terms, chroma refers to the intensity or saturation of colours, while hue is the colouration. For example, not all reds are the same because some contain more blue tones while others have more red or yellow. Using CRI as a means to measure colour quality may result in over- or under-saturated illuminants, possibly in different hues and resulting in distinct light qualities even though they have the same CRI.
In 2015, the Illuminating Engineering Society (IES) launched TM-30, IES Method for Evaluating Light Source Color Rendition, to provide an accurate description of LED light sources. An updated version (TM-30-18) was recently released.
Some of the key differences between CRI and TM-30 are the former uses eight colour samples as reference. In addition to the limited colour samples, all of the representative colours are pastel and do not properly represent a light source’s ability to render red. In response to this gap, a ninth colour sample (i.e. red) called R9 was created. This R9 sample is sometimes referenced specifically in addition to CRI to provide some context on the red fidelity of a light source. On the other hand, TM-30 uses 99 colour samples. These were scientifically chosen to represent millions of colours, and could also provide information on hue, chroma, and lightness for each sample. The same information—the spectral power distribution of the light source (i.e. the representation of the power emitted by a light source at each or band of wavelength)—is used to derive the data for both CRI and TM-30. However, the latter provides a more detailed description of the light quality.
TM-30 conveys information relative to the primary parameters of colour fidelity (Rf) and gamut (Rg), and it also provides a colour vector graphic as a visual representation of the deviation between the gamut area of the light source compared to that of the blackbody radiator.
The colour fidelity index measures the fidelity (i.e. accuracy) of a light source with a reference illuminant on a scale from zero to 100, making it very similar to CRI. For many of the blue-pump phosphor LEDs currently in production, Rf is very close to CRI with the former being slightly lower. However, with new technologies like narrowband phosphors and quantum dots, larger differences may be observed as the 99 colour samples of TM-30 provide a fidelity reference across all rendered colours.
The gamut index signifies how much saturation a light source has. An undersaturated light source makes colours appear pale or whitewashed, while an oversaturated illuminant renders more vibrant colours. The gamut index is expressed with positive and negative numbers, providing a reference to the quantity of change as well as the direction of the change ( if the source is over- or under-saturated), which is one of the limitations of CRI and the colour fidelity index.
Information regarding local colour fidelity and chroma and hue shift for all 16 hue bins was added to TM-30-18. The colour spectrum of the light source is divided in 16 equal pie slices, allowing one to obtain specific information relative to the hue and chroma of each. Therefore, an oversaturation in the red spectrum or an undersaturation in the green spectrum can be identified. This updated technical memorandum is timely with light quality initiatives that are constantly growing in importance.
Sign up for our weekly newsletter
Construction Canada weekly newsletters give the latest AEC industry news for those who build, design, engineer, specify, renovate or operate in the built environment.
Products & Services


Read the Latest Issue