
Surveying the construction/design landscape
Every year, we ask readers of Construction Canada to weigh in on the current state of the country’s design/building industry and where they think it is going next.
Demographics
This year we received input from all regions of Canada, with slightly more from Atlantic Canada and Saskatchewan, compared with the 2017 survey. Many professions within the design/construction sector were represented. Almost 30 per cent of respondents describe themselves as architects, and a further 16 per cent are project managers. But many respondents would not be pinned down, with 21 per cent choosing “Other”.
Men made up 78 per cent of the respondents, and more than half of those who answered the survey are more than 50 years old. Only five per cent of respondents are less than 30 years old. Experience and longevity, measured by asking, “How many years have you been in the business?” is more evenly split. Fifteen per cent of respondents have less than 10 years in the business, while 37 per cent have more than 30 years under their belt. In this “experienced” group—those who have more than 30 years in the business—project managers, specifiers, and consultants are more highly represented.
The specified slider does not exist.
Work/life balance
Across the construction industry, people work hard. More than 50 per cent of respondents put in more than a 40-hour work week. At the same time, the majority are satisfied with their work/life balance, and are generally as satisfied, or more satisfied, than they were five years ago.
Asked “Where do you plan to be five years from now?”, almost half of respondents (47 per cent) plan to be in a similar position, and a further 20 per cent have ambitions to be in a management position. Only 10 per cent envision leaving the industry, and another eight percent hope to be retired.
It would appear from our respondents general contractors (GCs) put in the most hours among the job titles we surveyed. For all respondents, 41 per cent work 35 to 40 hours per week, and a further 35 per cent work 41 to 50 hours. Twelve per cent work a longer week, 51 to 60 hours, and 6 per cent clock in at 61 hours or more. Among those who responded as GCs, 36 per cent work 51 to 60 hours or more, and a further 12 per cent work 61 hours or more. Engineers also recorded a slightly higher response, 16 per cent, in the 51 to 60 hours cadre.
The specified slider does not exist.
How has the economy affected your company in the past year?
“Recent carbon taxes and minimum wage increases have driven up construction costs.”
“Less work available. More non-billable time spent preparing proposals.”
“We are tightening our project time to compete with other big firms; less design time and drafting time.”
“Land prices and salaries remain stable but the cost of construction and the cost of providing cities with more and more documentation is increasing. This has put pressure on construction costs and profitability which in turn has increased costs to the architect.”
The specified slider does not exist.
The survey asked how firms’ profitability is now, compared with five years ago. For almost two-thirds of respondents, profitability was the same or better.
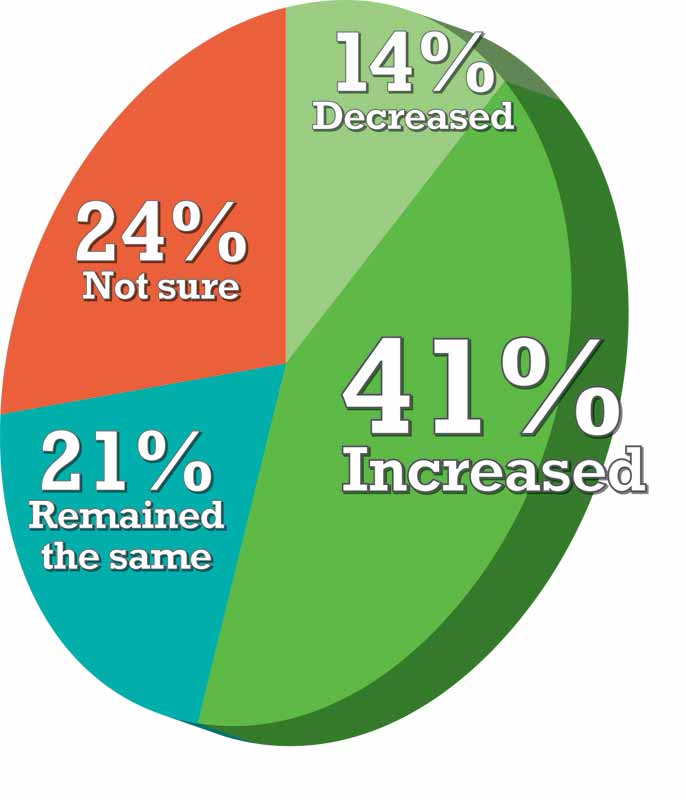
Among those who say business profitability has decreased, the cited reasons are frequently: an economic downturn, taxation, downward pressure on fees, or increasing professional responsibilities. New companies, young architects, and offshore competition are often blamed for pushing fees down.
Among respondents who say profitability has increased, favourable markets, acquisition/consolidation among firms, and operational efficiencies are often noted. Good management was frequently cited, but, when that was not the case, one respondent had this solution: “Bypassed upper management to implement technological improvement.”
Other responses to “To what do you attribute the change?”
- Better systems, smarter quoting.
- Expanding product offerings, expanding geographically.
- Good client relationships, good management.
- Larger projects, more efficiencies.
- Integrating better software tools, more efficient processes, and system upgrade.
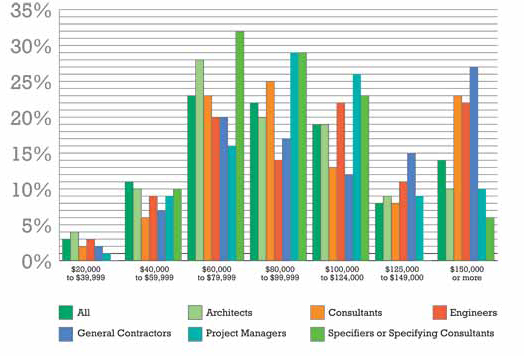
Let us talk money
The following graph shows percentage of respondents in each salary range. In addition to the overall results, we have teased out specific salary information for some groups of respondents, based on their job title.
Frustration on the job
Construction Canada’s salary survey gives participants the opportunity to share their opinions and vent their frustrations. Collecting fees from clients is a major sore point, as are bureaucracy and a lack of skilled tradespeople. Evidently, there is never enough time in a day, stress is rampant, and communication issues are a frequent problem.
Among this year’s responses were many examples of the generation gap, and a few comments on gender equality. Here are some examples:
“[I] have to perform my work in a much less efficient manner to satisfy the struggles and limitations of the technological comprehension of my over-50 colleagues.”
“[Juniors] seem to spend more time managing their to-do list than actually doing productive work.”
“The older generation struggles to understand technological opportunities.”
“Young people who don’t seem to be dedicated to the job.”
“Lack of accountability among Gen X staff.”
Other frustrations:
“Design used to be interesting, and now is such a small percentage of the job, the work has become a job.”
“Clients can be disrespectful and unrealistic, and don’t know what their part of the job is.”
“Contract administration documentation requirements seem to have ballooned over the past 10 years.”
“Dealing with clients who think they know more than the consultants (architects and engineers), in addition to taking advice from Tom, Dick, and Harry as valid recommendations, equal in weight to those of the consultants.”
“Everyone talks sustainability, but hardly anyone is really interested in any sustainable results. It is a pure marketing scam.”
“I think the speed of the construction industry is crazy, with e-mail, PDFs, and just the general pace of everything. It seems projects get started very quickly without making sure all the pieces are in place. Everyone is rush, rush.”
“Preventable stress and overtime due to inefficiencies in project management.”
“Fees have gone down, expectations have gone up, and [availability] of skilled help to produce the work has gone down.”
Tools of the trade
Social media use among participants in the Construction Canada survey remains virtually the same as last year, but there are notable differences among the habits of different age groups.
Sixty per cent of respondents less than 35 years old use social media for professional purposes. That portion rises to 69 per cent for those 35 to 49 years old, and drops to 51 per cent for those more than 50 years old.
The specified slider does not exist.
What makes people happy?
Among those who are more or equally satisfied with their work, respondents often attribute that satisfaction to: more responsibility, more opportunity, more control, more challenges.
Other insights from this group:
“In a smaller office, we get to wear many hats, which keeps the job interesting and challenging.”
“I am in charge of my day. The work is challenging and rewarding.”
“I like what I do and I work with a great team who are focused on results and work well together. We have the opportunity and funds to think, make decisions, and do the right thing.”
Opinions from the “less satisfied” respondents emphasize stress and inadequate pay.
“I love my job, but the construction market is so competitive that you never truly feel secure in your job. You could lose your job tomorrow to someone who makes less money in order to keep the profit margin.”
“I am working far more hours for the same pay as years ago, as the industry is now price-based and the selection of an architect is no longer based on quality. The fees are literally half of what they were 10 or 15 years ago. By the time we pay the engineers, there is nothing left.”
Sign up for our weekly newsletter
Construction Canada weekly newsletters give the latest AEC industry news for those who build, design, engineer, specify, renovate or operate in the built environment.
Products & Services

Read the Latest Issue
